
Next Up: The Coming Gold Rush.
Gold: $1,906
Silver: $22.74
Copper: $2.90
Platinum: $914
Palladium: $1,480
Rhodium: $10,100
Antimony: $2.76 pound
Uranium: $32.50 pound
Gold: This date marks the first time gold closed above the $1,900 level in nearly nine years, approaching the then-all-time high of approximately $1,921 set in September 2011.
Silver: On this date, the Gold:Silver Ratio at 83:1 is beginning to “catch up” to gold’s rally. The ratio, which had reached historic extremes earlier in the year (peaking near 125:1 in March), is compressing rapidly as silver is outperforming gold in percentage terms.
(The “80 Rule”: In precious metals analysis, a ratio above 80 is often viewed as a signal that silver is historically “cheap” or undervalued relative to gold. On this date, the market was just beginning to move away from those extreme “cheap” levels.)
Copper: By July 24, copper had surged nearly 45% from its March 2020 lows (approx. $2.00/lb). This was driven by a supply crunch in South American mines and massive infrastructure stimulus from China. While gold and silver are rallying on “fear” and currency hedge plays, copper’s rise signaled that the industrial world was turning the lights back on.
Historical Gold to Silver Ratio
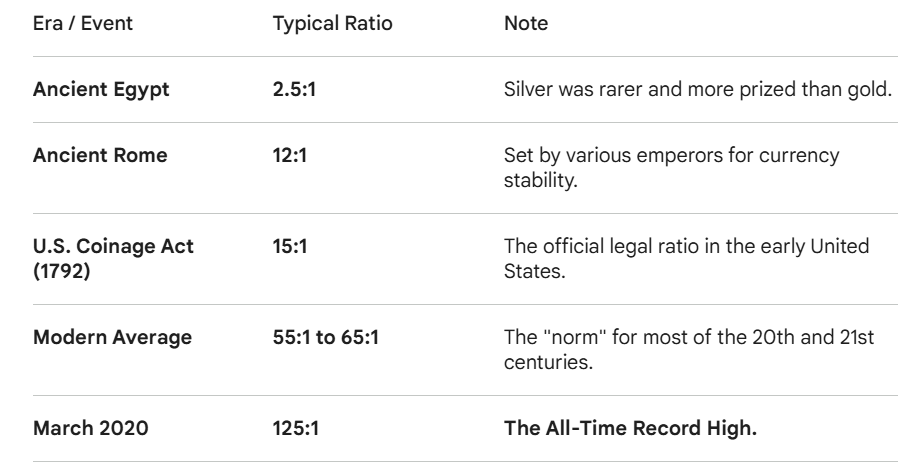
For decades, the 80:1 level was seen as the “hard ceiling” where you were supposed to back up the truck for silver. When it blew past 80, then 90, then 100, a lot of “mean reversion” traders were likely getting margin called or shaking their heads in disbelief. The lesson of 125:1 was a brutal reminder that liquidity trumps history during a crash. Even if you’re right about the long-term value, the market can stay “irrational” (or in this case, illiquid) longer than most people can stay solvent.
Lesson to be learned and Here is why “history” failed so spectacularly in March 2020:
1. The Liquidity Vacuum
In the initial panic of March 2020, investors didn’t care about “value”—they cared about cash. When the stock market started tanking, traders had to sell whatever they could to meet margin calls. Gold is the most liquid asset in the world, so it held up better. Silver, with its much smaller and thinner market, saw its bid side completely vanish. It wasn’t a “valuation” move; it was a “forced liquidation” move.
2. The Industrial “Off Switch”
Since about 50-60% of silver demand comes from industrial use (electronics, solar, etc.), the global lockdown looked like a death sentence for silver demand. Gold, being almost purely a monetary/psychological asset, didn’t have that “factory shutdown” risk. This caused the two metals to decouple more violently than at any point in the last 5,000 years.
Gold Rush Isn’t Coming – It’s Arrived.
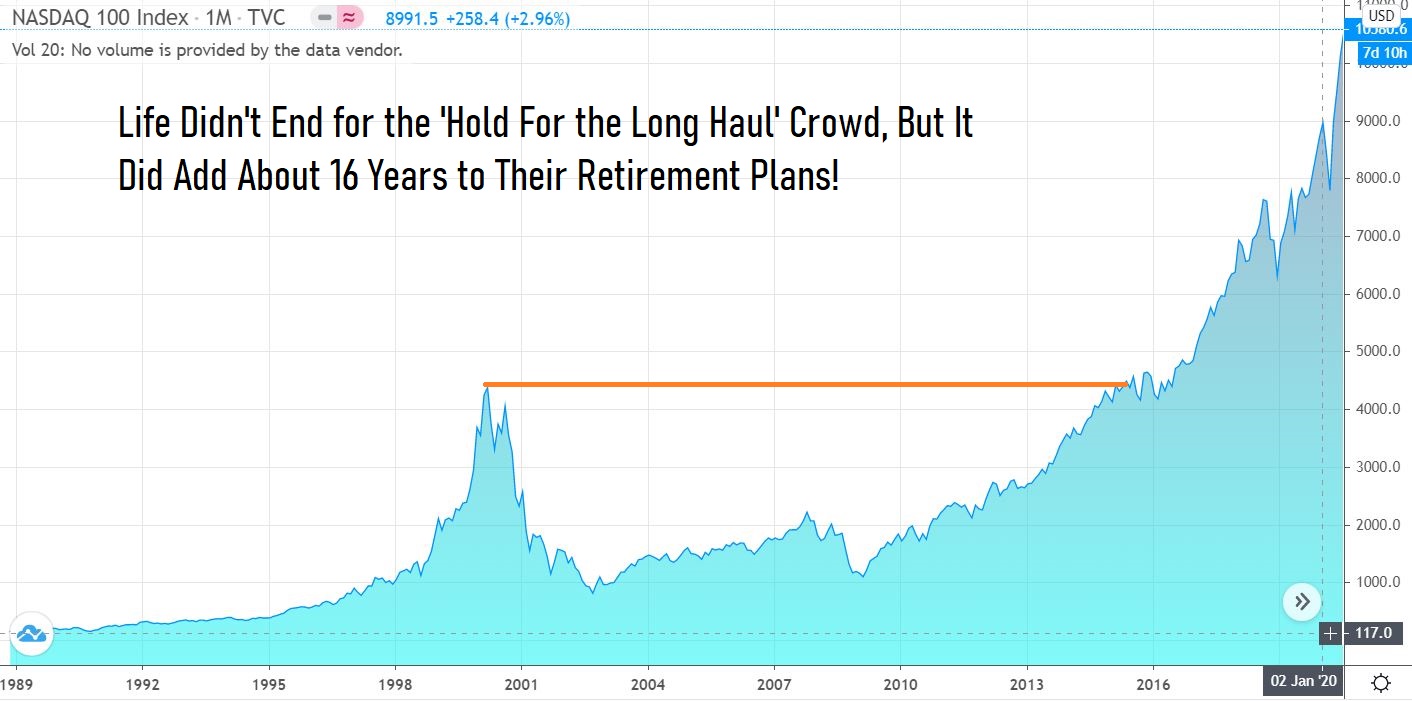
The NASDAQ just set a new record crossing 10,000 and is about to set another new record for the longest streak without back-to-back losses. This as we read somewhere, “will end in tears.”
Our opinion is that Gold will also end up in tears, but rather in tears of joy!
We’ve been in 7 significant bear markets since 1973. Some small and drawn out painful (2000-2003) and some fast and quick like 1987. Here’s the thing. Bear markets are normal. Life doesn’t end if you sit pat and take your punishment, for listening to advisors who say “no one can successfully time the market and if you missed the top X months in the market blah, blah.”
As you tightly hold the steering wheel while the car careens off the cliff. You can just wait, sometimes for as long as a decade, to get even. But you probably will eventually get even.
Our mission here isn’t to time the market and run for cover.
Our mission, as we believe the market is nearly perfectly set up for one of the worst bear markets in history – is to make more money in the next five years than we ever had in our 47 years on Wall Street (starting as a runner in high school). And we believe gold, gold ETF’s, gold-stock mutual funds, and direct ownership in Senior and Junior gold miners will play a major role. More about that in another letter.
We’ve become experts (self-proclaimed) at spotting developing manias by simply recognizing when everything we touch suddenly seems to go up (not to be confused with genius). On the reverse, when you use stop loss orders and keep getting repeatedly stopped out, this tells us when the mania is over (not to be confused with being a loser).
We once saw a bumper sticker that said, “Please, God, give me one more bull market. I promise not to waste this one.“
And that’s where we are today. Don’t waste this one. Gold has had many bull markets in the past, but we believe this will be the biggest and most impressive of all time.
We think the next stop is Gold $2,000. And that is when a mania could start to form – after a new and unchallenged high, combined with growing investor FOMO (fear of missing out). Next stop after that could be $5,000 propelled by a falling US stock market, where many (not all) stock investors – $35 trillion at this peak – who are seeking other places to invest, discover gold and gold stocks.
The other alternatives? Long-term bonds – don’t think so. Cash at 1% – don’t think so. The first wave of safe-haven seekers can take gold to $5,000. The second wave, the momentum buyers who buy anything solely ‘because‘ it’s going up (think Bitcoin from $3,000 to $20,000), can take gold from $5,000 to $10,000. We think they’ll arrive and full effect of their buying will be felt in 2024 or 2025.
So there we said it. $10,000 gold.
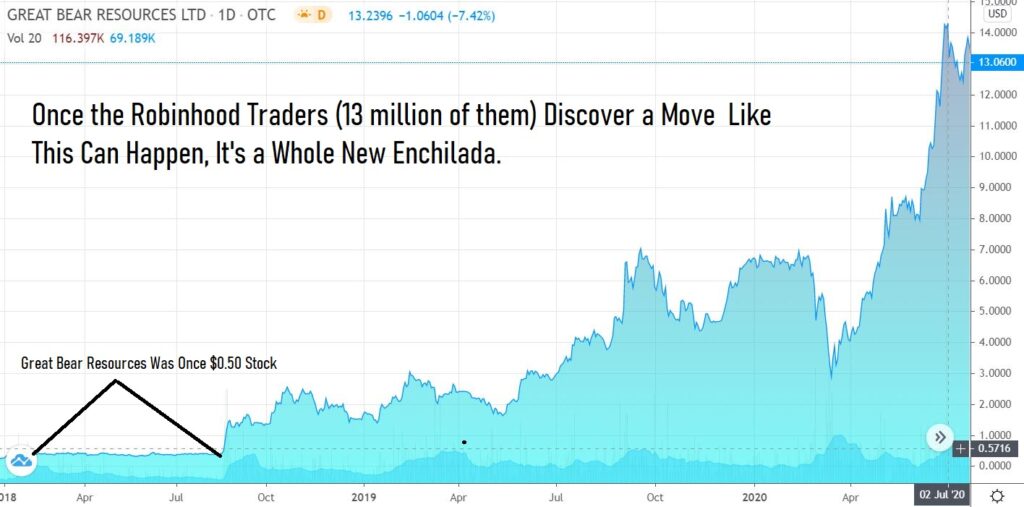
More importantly, during this process, the Robinhood Cyborg traders will discover nearly everything in Canada sells for pennies or under $10, vs $1,500 for Tesla. We believe more wealth will be created by investing in the mining sector than is imaginable. As gold goes up, gold mining stocks, ‘generally speaking,’ go up even more. It’s going to be a wild ride, so buy your ticket to the show early! Mark our words, NOW is the time.
ONCE THE ROBINHOOD TRADERS SEE THIS…
Great Bear Resources (GTBAF)
We have been doing this for 3 years since we launched the Gold Street Journal since renamed to Institutional Gold Research.
.")
 Pushes SekurOne Closer to Market With First International Encrypted Call")

! From $8.86 to $47.21, up 432%.")
 $8.91, to Watch List.")

.")
 Pushes SekurOne Closer to Market With First International Encrypted Call")
