
There’s a saying, “..skate to where the puck is going, not where it has been.”
Love that saying but when everyone is trying to skate to where the puck is going, they usually move in packs. So keep that in mind. They can love it one day, hate it the next – but this inflow (see the decades long calendar below) is definitely worth noting.
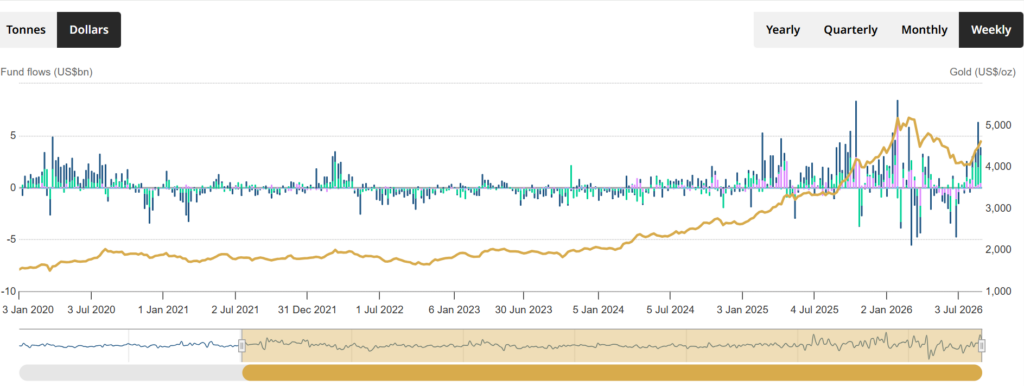
After large outflows following market peak last January, the wave coming back in for August can be only described as Tidal Wave in size. The third largest in history. But nothing in our opinion, when compared to what’s coming, when the FOMO and momentum players show up, once Gold crosses $10,000.
Société Générale analysts Michael Haigh and Jeremy Sellem on Monday said “In August, gold ETFs registered a substantial 201 tonnes of net inflows, marking the third-largest monthly addition on record in tonnage terms after now famous world events: February 2009 and the stimulus package announced by the newly inaugurated Obama administration, and March 2020, with the start of the lockdown for Covid globally.” 201 tonnes in August they mention converts to roughly $23–26bn in a single month!
This month’s inflow also surpassed the strong inflows recorded in March 2022 following Russia’s invasion of Ukraine and in September 2012 after the Federal Reserve’s announcement of QE3.
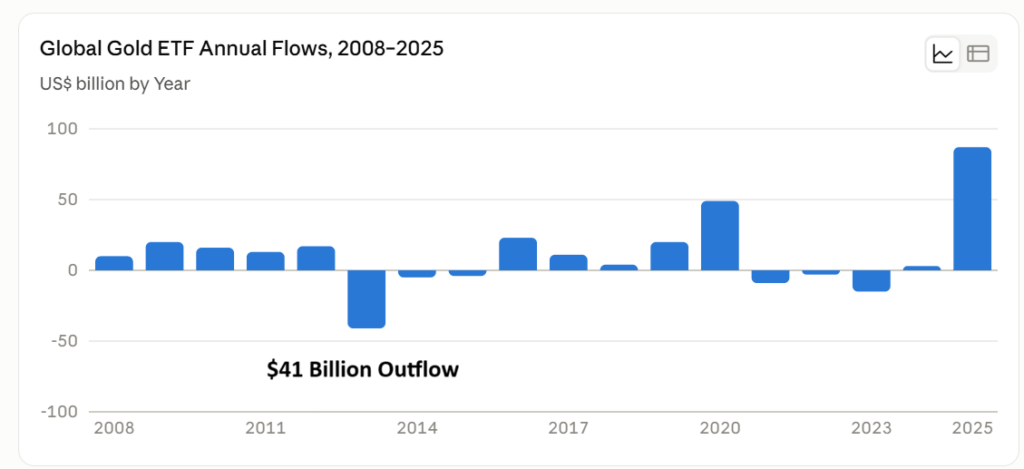
Annual Flows
Weekly Flows
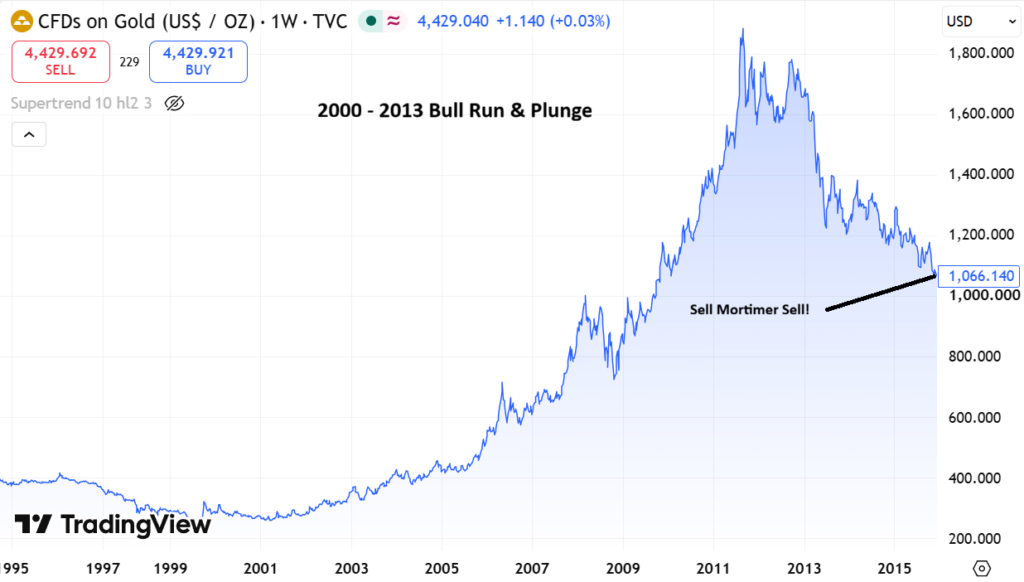
The 2013 outflow is widely known as the “taper tantrum” year, when the Fed signaled it would start winding down its bond-buying program, real yields spiked, and gold (which pays no yield) became much less attractive relative to bonds. That combination – falling gold price + rising opportunity cost of holding it — is generally cited as the driver behind the record $41B outflow.
Taper Tantrum
*Worth flagging as the flip side: March 2026 saw the largest monthly outflow ever recorded, –$12–13bn, driven almost entirely by North America after the Fed’s post-Iran-strike pivot away from rate cuts
Of course someone sold at the 2015 low..
…but of course someone bought at the 2015 low..
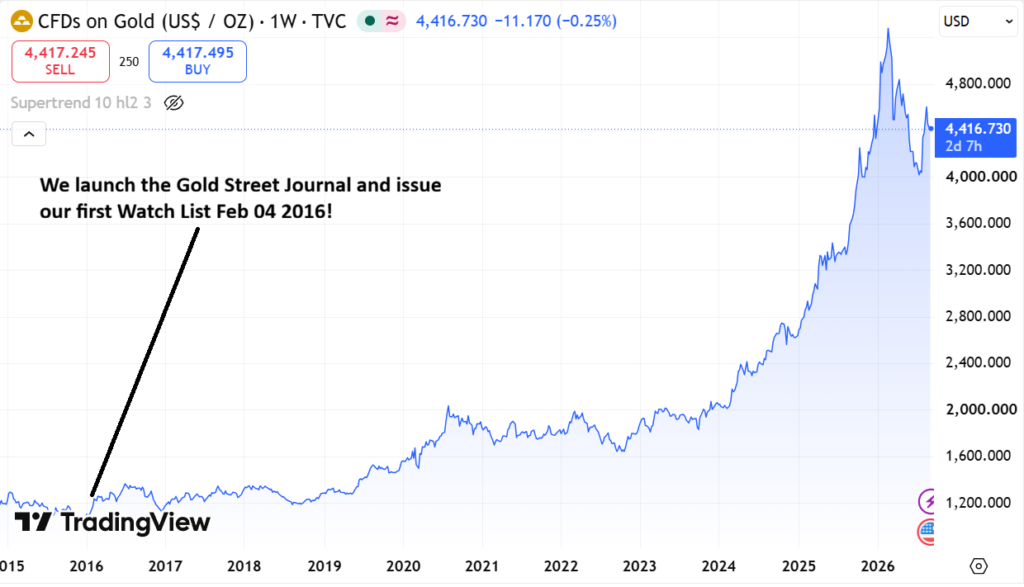
Meaning us! We waited until 2016 (a five year wait) before we launched the Gold Street Journal and issued our first Watch List.
Gold Street Journal Launched. Nineteen Names Added to Watch List.
Featured Company: Fairchild Gold (FAIR.V)
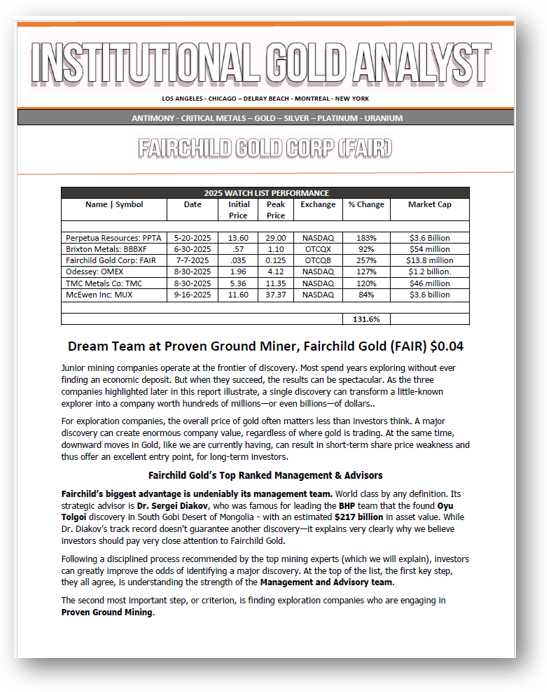
Fairchild Gold and TerraEye Launch Property-Wide Satellite Spectral Mapping Program.
AI-assisted mineral and alteration mapping will provide an independent property-wide exploration layer across underexplored ground beyond the known Gold Coin and Hidden Hill deposits.
Vancouver, British Columbia and Las Vegas, Nevada–(Newsfile Corp. – September 9, 2026) – Fairchild Gold Corp. (TSXV: FAIR) (FSE: Y4Y) (OTCQB: FCHDF) (“Fairchild” or the “Company”) is pleased to announce that it has engaged TerraEye to undertake a property-wide satellite-based spectral mapping and structural interpretation program at the Company’s 100%-owned Golden Arrow Gold-Silver Project, located approximately 35 miles east of Tonopah in Nye County, Nevada.
The program is designed to provide a broad, objective first-pass assessment of surface mineralogical and alteration signatures across the entire Golden Arrow property, with particular emphasis on underexplored areas outside the known Gold Coin and Hidden Hill deposits and around the past-producing mine workings on the property. TerraEye will integrate satellite spectral analysis, image enhancement, structural lineament interpretation and AI-assisted pattern recognition to identify areas believed to warrant geological review and field follow-up.
When integrated with Fairchild’s geological, geochemical, and geophysical datasets, these surface and structural indicators may also help refine interpretation of concealed or partially covered mineralized systems, extensions of known old mine workings, and the subsurface gold-silver mining targets that they may represent.
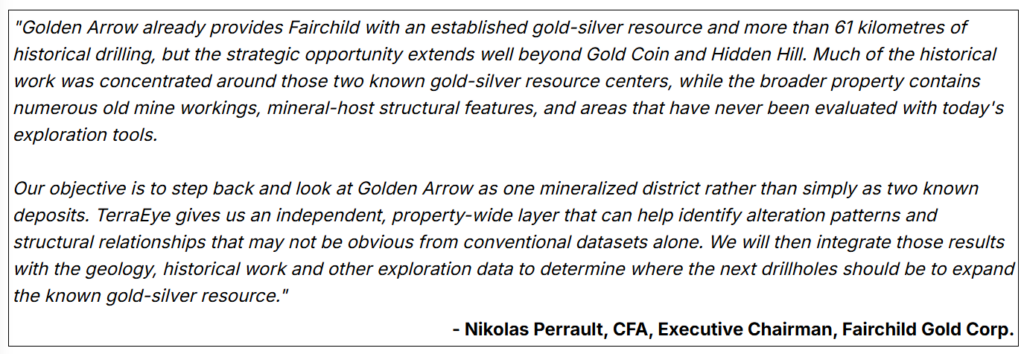
Institutional Gold Analyst: 2026 Watch List Released.
Institutional Gold Analyst, 3rd Quarter Performance Update.
Largest Annual Gold ETF Inflows (Global, $ Terms):
2025 — $89bn — WGC’s official record: “the largest on record,” as gold shattered its own price record 53 times that year, delivering its strongest performance since 1979.
2020 — $47.9bn (WGC’s own figure; SPDR’s chart data shows ~$49.5bn) — the COVID-driven record that stood for five years before 2025 blew past it.
2016 — $23bn — the Brexit-vote year; gold ETFs saw huge single-day and single-month inflows around the June 2016 referendum.
2009 and 2019 — tied at $20bn each — 2009 was the post-financial-crisis flight to safety (also a record year in tonnage terms at the time); 2019 was the pre-COVID rate-cut cycle building momentum into 2020.
2012 — $17bn — the year the Fed launched QE3 (announced September 2012), a major driver of gold demand that year. Hope you didn’t skate to this puck!
Disclaimer
InternetStockReview.com (Institutional Gold Analyst)
Cautionary Statement Regarding Forward-Looking Information
Certain information contained in this update constitutes “forward-looking information” or “forward-looking statements” (collectively, “forward- looking information”). Without limiting the foregoing, such forward-looking information includes statements regarding the Company’s business plans, expectations and objectives, and not limited to the closing of the Transaction and receipt of all necessary approvals. In this news release, words such as “may”, “would”, “could”, “will”, “likely”, “believe”, “expect”, “anticipate”, “intend”, “plan”, “estimate” and similar words and the negative form thereof are used to identify forward-looking information. Forward-looking information should not be read as guarantees of future performance or results, and will not necessarily be accurate indications of whether, or the times at or by which, such future performance will be achieved. Forward-looking information is based on information available at the time and/or the Company management’s good faith belief with respect to future events and is subject to known or unknown risks, uncertainties, assumptions and other unpredictable factors, many of which are beyond the Company’s control. For additional information with respect to these and other factors and assumptions underlying the forward-looking information made in this news release, see the Company’s most recent Management’s Discussion and Analysis and financial statements and other documents filed by the Company with the U.S. and Canadian securities commissions and the discussion of risk factors set out therein. Such documents are available at otcmarkets.com and www.sedarplus.ca under the Company’s profile and on the Company’s website. The forward-looking information set forth herein reflects the Company’s expectations as at the date of this news release and is subject to change after such date. The Company disclaims any intention or obligation to update or revise any forward-looking information, whether as a result of new information, future events or otherwise, other than as required by law. Revelers Media an associated firm of Institutional Analyst and Institutional Gold Analyst may be hired by Companies to build news related websites to disseminate news and SEDAR filings for a monthly retainer. It may further negotiate for an equity stake in such companies. In instances where Institutional Analyst is additionally contracted and compensated to author investment research reports, full disclaimer and disclosure details will be included in company specific report. We have in the past and will in the future be retained by Companies, Hedge Funds and large individual and institutional investors.